Optimizing Data Sources: SNMP vs. UPnP

Optimizing Data Sources: SNMP vs. UPnP

April 18, 2026 · 5 min read
S
Sofia Duval · April 18, 2026 · 5 min read

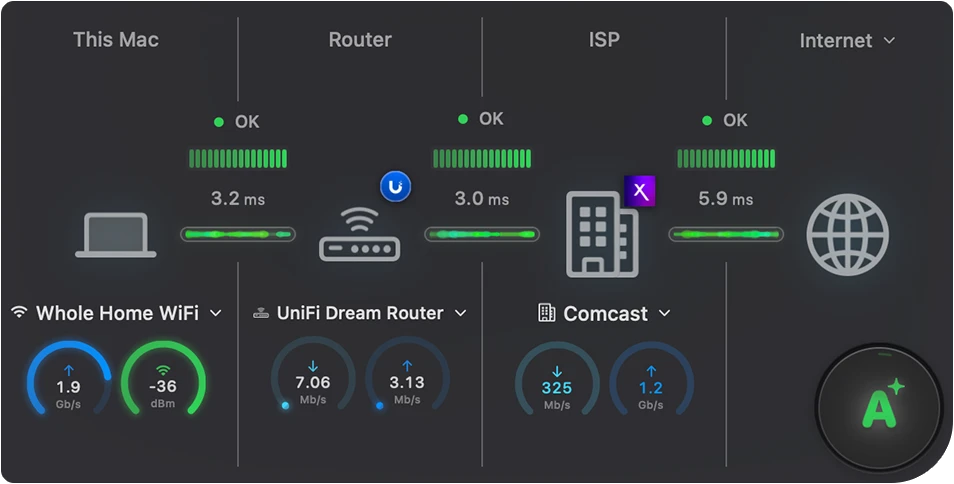
In the modern digital landscape, visibility is the cornerstone of efficiency. Whether you are a remote professional, a creative professional handling massive file transfers, or a small business owner managing a local network, understanding exactly how your bandwidth is being utilized is no longer a luxury—it is a necessity. PeakHour 6 has established itself as the premier tool for macOS users to gain this insight, offering a real-time, high-fidelity look into the data flowing through routers, switches, and individual devices. However, simply installing the application is just the beginning. To truly master your network, you must understand the nuances of data collection and the advanced configuration options that allow PeakHour to act as a sentinel for your connectivity.

The transition from basic internet usage to professional network management begins with the realization that your ISP’s "speed test" is only a tiny snapshot of a much larger picture. PeakHour provides a continuous, historical view of your network's health, allowing you to identify patterns that a single test would miss. This is particularly crucial when diagnosing intermittent lag during video conferences or unexplained slowdowns during peak hours. By leveraging the power of SNMP (Simple Network Management Protocol) and UPnP (Universal Plug and Play), PeakHour transforms raw data into actionable intelligence, presented directly in your macOS menu bar or a dedicated dashboard.

Optimizing Data Sources: SNMP vs. UPnP

One of the most common questions users face during the initial setup of PeakHour 6 is which protocol to use for monitoring their gateway. While UPnP is often the easiest to configure—frequently requiring nothing more than a single toggle in your router’s settings—SNMP is the gold standard for those seeking professional-grade accuracy. SNMP provides more granular data and is generally more reliable across different hardware manufacturers. If your router supports SNMP (common in "prosumer" gear from brands like Ubiquiti, Mikrotik, or Synology), it is highly recommended to enable it.

Setting up SNMP requires a "Community String"—essentially a password that allows PeakHour to read the data. Most routers default this to "public," but for security, you should change this to a unique string and reflect that change within the PeakHour connection settings. Once configured, you will notice a significant improvement in the responsiveness of your real-time graphs. The precision of these readings is what sets PeakHour apart. Much like the way a horologist values the micro-adjustments in a high-precision timepiece, or the way a connoisseur might examine the fine details of replica rolex watches to appreciate their mechanical complexity, a network administrator relies on the accuracy of SNMP to ensure every kilobit is accounted for.

Customizing the Dashboard for Workflow Integration

The Internet Dashboard in PeakHour 6 is more than just a collection of moving lines; it is a customizable command center. For users who manage multiple connections—perhaps a primary fiber line and a secondary 5G backup—the ability to aggregate these views is invaluable. PeakHour allows you to create "Total" monitors that combine the throughput of several interfaces into a single, easy-to-read graph. This is essential for ensuring that your failover systems are working as intended and that your total data consumption stays within any monthly caps imposed by your service provider.

Optimizing Data Sources: SNMP vs. UPnP
Image courtesy of Unsplash

Beyond simple monitoring, the aesthetics and placement of your data matter. macOS users often have crowded menu bars, and PeakHour addresses this by offering highly configurable menu bar icons. You can choose to display a compact graph, numerical throughput, or a simple "traffic light" indicator that changes color based on current load. This allows for "passive monitoring"—the ability to check your network status with a sub-second glance without breaking your creative flow.

"The goal of network monitoring is not to stare at graphs all day, but to create a system where anomalies become immediately obvious, allowing you to return to your work with confidence."

For those who require deeper dives, the history view in PeakHour is a powerful forensic tool. By analyzing usage over days, weeks, or months, you can identify "bandwidth hogs" on your network. Is a background cloud backup service saturating your upload during work hours? Is a smart TV streaming 4K content in the other room when it should be off? These are questions that PeakHour answers with clarity, allowing you to implement Quality of Service (QoS) rules on your router with surgical precision.

Advanced Troubleshooting and Performance Tuning

Even with the best tools, networks can be finicky. PeakHour 6 includes several diagnostic features designed to help you figure out why a connection isn't appearing or why the data seems "spiky." One of the first things to check is the polling interval. By default, PeakHour checks your devices every few seconds. On some lower-powered consumer routers, polling too frequently can actually cause the router's CPU to spike, leading to the very lag you are trying to avoid. If you notice your router struggling, try increasing the polling interval to 5 or 10 seconds.

Another common hurdle is the "Double NAT" scenario, often found when a user connects their own high-end router to a modem/router combo provided by their ISP. In this setup, PeakHour may have trouble finding the external gateway. The solution is usually to put the ISP's modem into "Bridge Mode," which passes the external IP address directly to your primary router. This simplifies the network topology and makes it much easier for PeakHour to grab accurate external traffic data.

Ultimately, the power of PeakHour 6 lies in its ability to make the invisible visible. When you can see your network's heartbeat, you are no longer at the mercy of "vague" internet problems. You can pinpoint the exact moment a connection dropped, the exact device that caused a slowdown, and the exact time of day when your ISP's performance begins to degrade. This level of control is what transforms a standard home office into a professional-grade production environment. By taking the time to fine-tune your configuration, optimize your data sources, and customize your dashboard, you ensure that your macOS workstation remains a high-performance hub, ready for whatever bandwidth-intensive tasks the future holds.

Twitter Facebook LinkedIn