Main View
Opening the main window
Section titled “Opening the main window”PeakHour’s main window is your primary view into network activity. There are two ways to open it:
From the menu bar. Click the PeakHour menu bar item. The exact information shown there depends on which Menu Bar Items you have configured in Settings → Menu Bar.

From the Dock. Click PeakHour’s Dock icon if it’s enabled. The Dock icon is on by default — toggle it from Settings → Dashboard.

Overview
Section titled “Overview”The main window holds up to four sections, one under the other, in one scroll view:
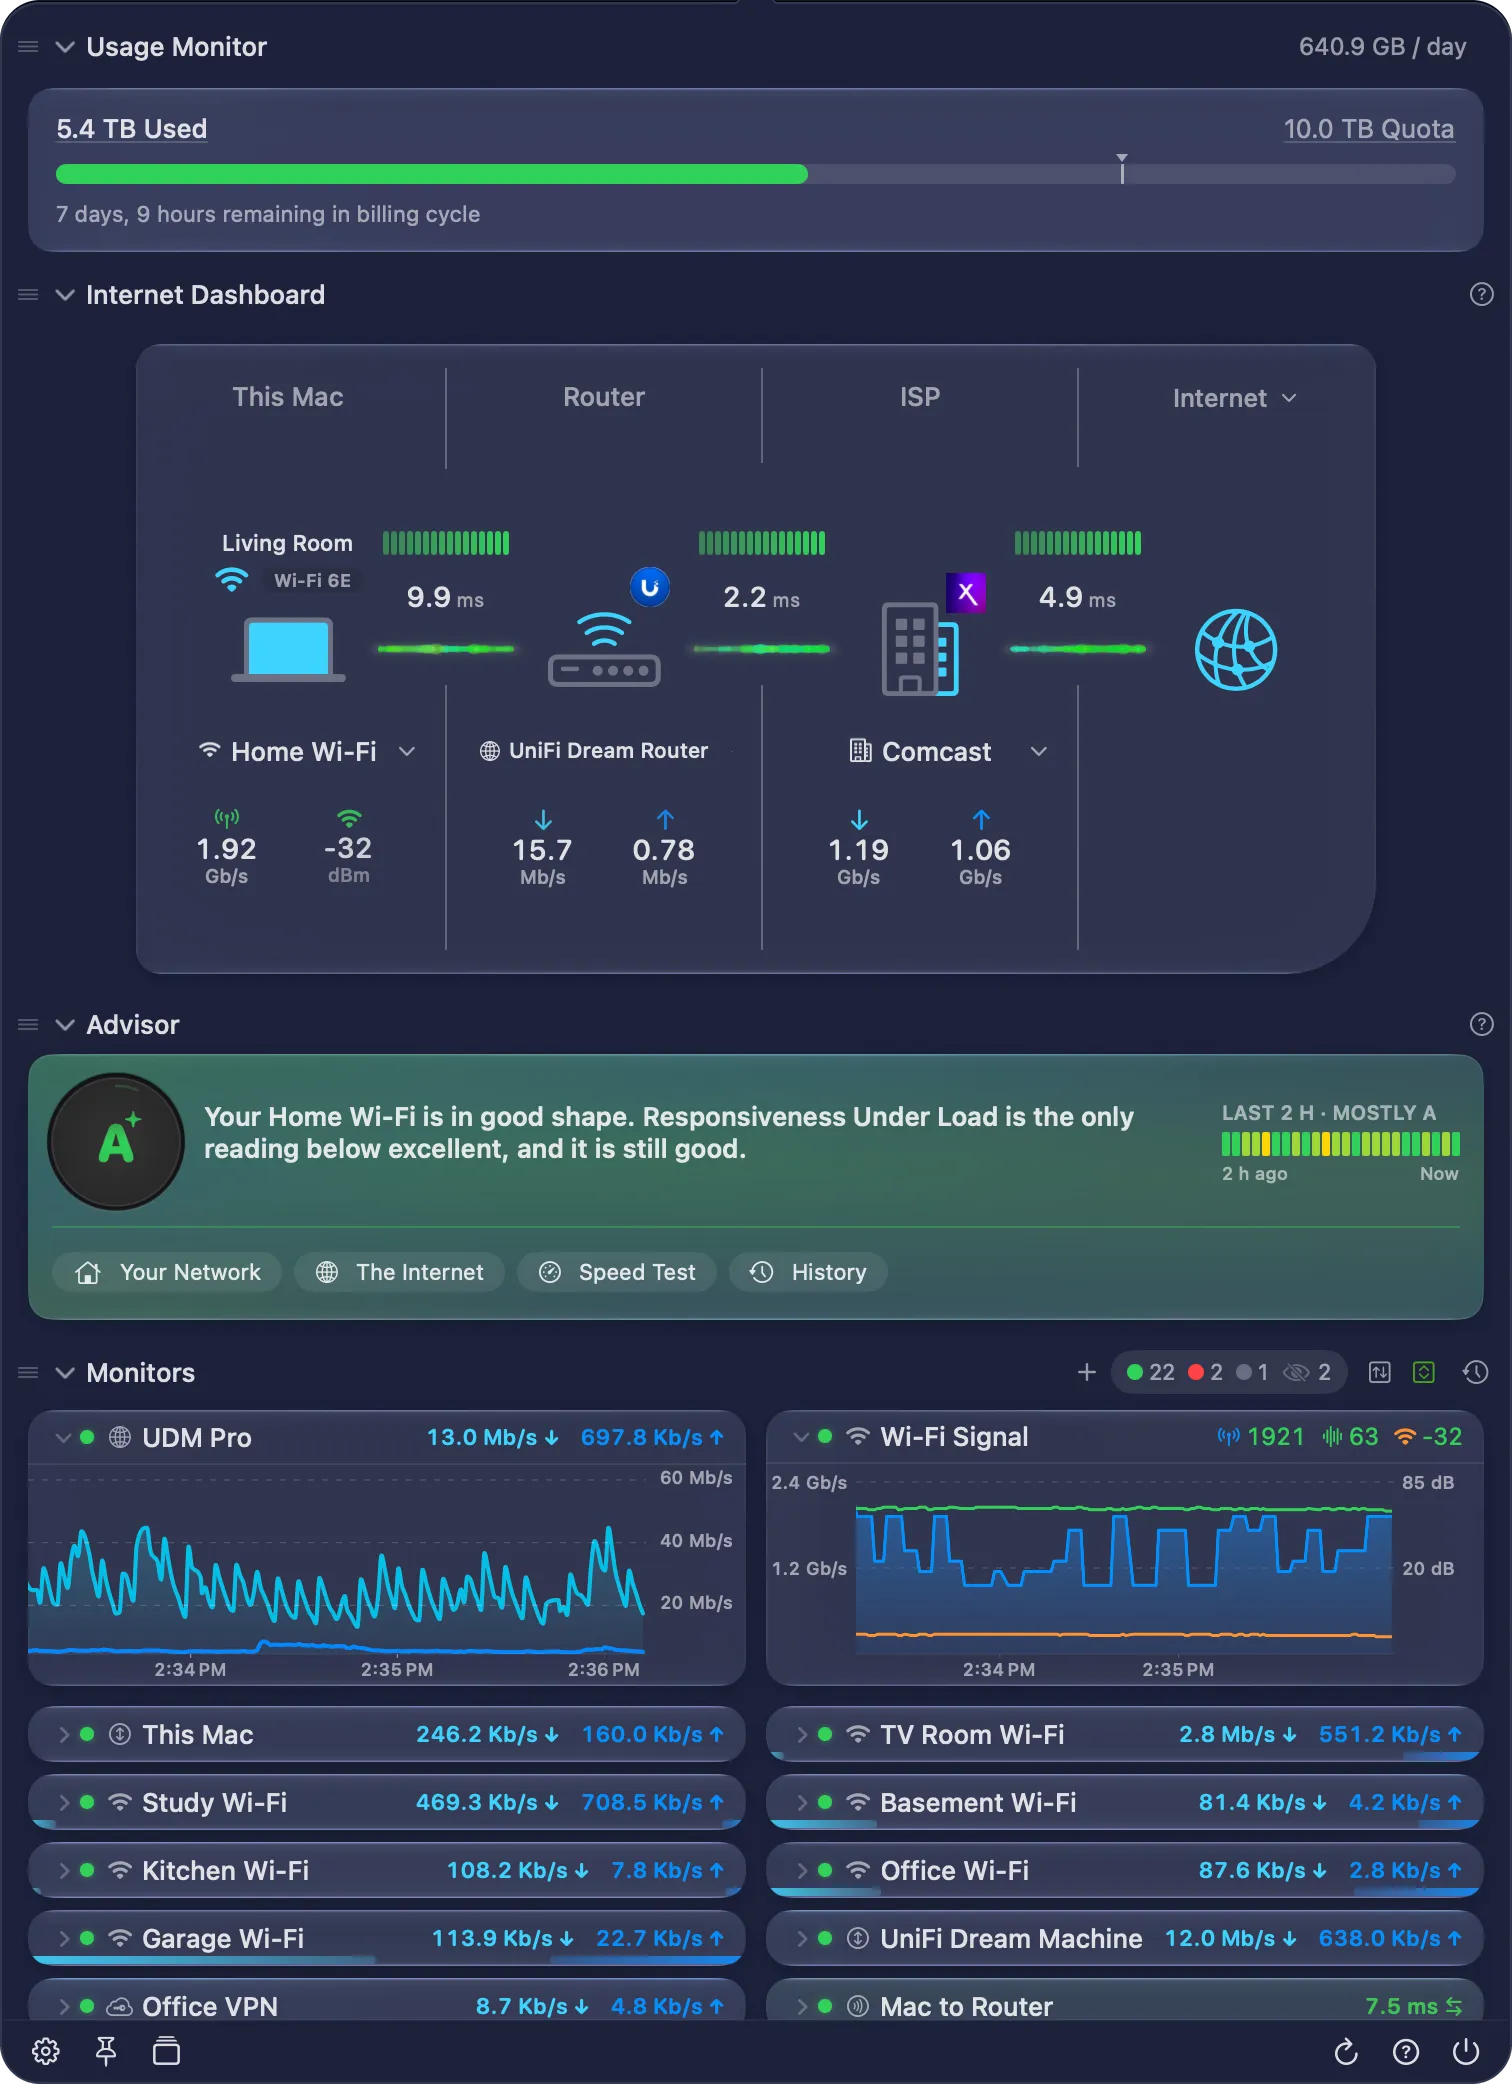
- Usage Monitor — tracks data used and remaining against your billing cycle quota. It shows only when Usage Monitoring is on.
- Internet Dashboard — a single-view summary of your connection’s health from your Mac out to the internet.
- Advisor — your grade, what holds it back, and your grade over the last 2 hours, with links to the PeakHour Advisor. It needs macOS 26 or later.
- Monitors — the graphs of all your monitors: bandwidth, latency and Wi-Fi Signal.
The window grows with its sections, up to the height of your screen. Then it scrolls. The footer stays in place while the sections scroll, and so does the title bar of a pinned window. Drag the side of the window to change its width. The height follows the sections.
The scroll bar of the main window follows Show scroll bars in System Settings → Appearance. With Always, or with a mouse connected, the bar always shows, and the window gets a little wider so that the monitors keep their columns.
Click the title of a section to collapse it or expand it. PeakHour keeps the state of each section.
Collapsed sections
Section titled “Collapsed sections”A collapsed Internet Dashboard or Advisor section still shows a one-line summary:

- Internet Dashboard — the Internet status, for example Internet OK or Netflix not responding, then the latency of each hop, for example Router 4.7 ms → ISP 2.1 ms. A pill at the right shows the Internet latency.
- Advisor — the status, for example Good, or the top issue, then your grade and a small grade timeline. The grade shows here only while the dashboard is hidden or collapsed.
Customize the main window
Section titled “Customize the main window”You can hide any section, and put the sections in any order.
Move a section
Section titled “Move a section”Drag a section by its header to a new place. A line shows where the section will go. The grip (≡) at the start of each header shows that you can drag it.
Show or hide a section
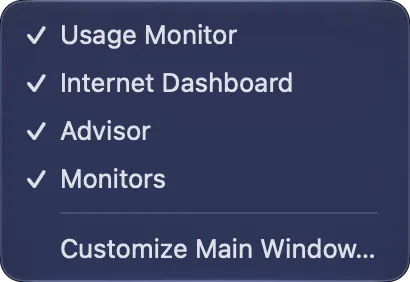
Section titled “Show or hide a section”Click Show Sections in the footer of the main window. The menu lists the sections, with a checkmark beside each section that shows. Choose a section to show it or hide it. It keeps its place.
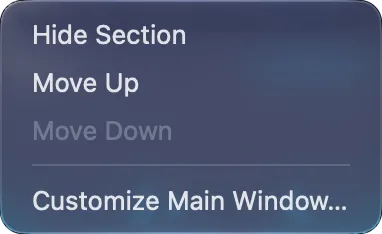
You can also right-click the header of a section:
| Item | Description |
|---|---|
| Hide Section | Removes the section from the main window. |
| Move Up, Move Down | Moves the section one place. They are grey for the first and the last section. |
| Show Section | A list of the hidden sections. Choose one to show it under this section. It appears only while a section is hidden. |
| Customize Main Window… | Opens Settings → Display → Main Window. |
In Settings
Section titled “In Settings”Open Settings → Display → Main Window. Select or clear the checkbox of a section to show or hide it. Drag a section to move it. The main window changes at once.
When you hide every section, the main window reads All Sections Hidden. Click Customize…, or use Show Sections in the footer, to show them again.
Your layout syncs to your other Macs with iCloud.
When you are offline
Section titled “When you are offline”When this Mac loses its connection for more than 3 seconds, a red label drops down at the top of the main window:

- No Network — this Mac has no network connection, for example when the Wi-Fi is off.
- No Internet — this Mac is on a network, but more than half of your Internet sites don’t respond.
After the first minute, the label also shows how long the outage lasts, for example No Internet · 2m. When the connection comes back, the label turns green and reads, for example, Back Online · 2m 14s, with the length of the outage. After 3 seconds it goes away.
The label stays in view while you scroll. Click its × to hide it until the next outage.
Was this page helpful?
Found something wrong, unclear, or out of date? Let us know and we'll fix it.