Monitors
The Monitors section of the main window holds the graphs of all your monitors, of every type:
- Bandwidth Monitors — upload and download throughput of a router, a device or an interface.
- Latency Monitors — latency, jitter and packet loss to a host.
- Wi-Fi Signal — the Tx rate, the SNR and the signal of this Mac’s Wi-Fi.
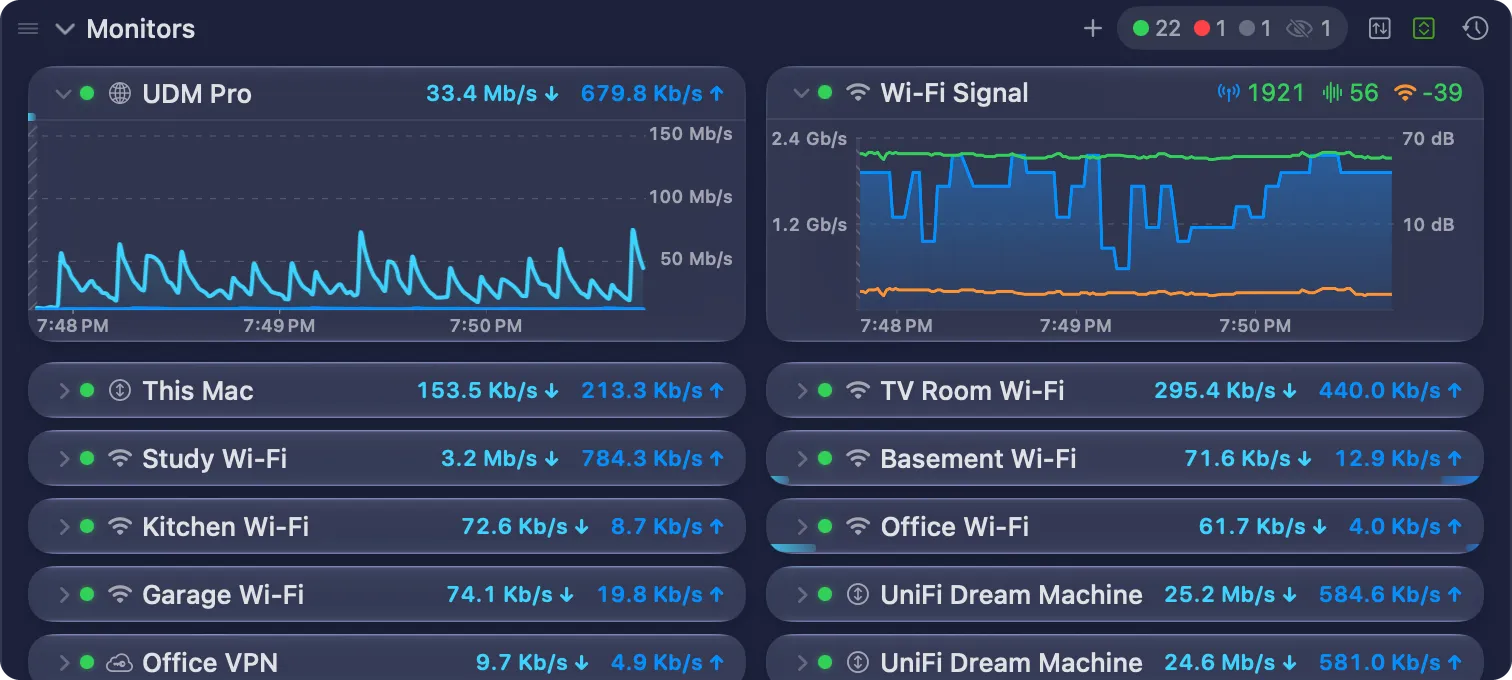
Section header
Section titled “Section header”The header bar above the monitors holds the controls for the whole section:

From left to right:
| Control | Description |
|---|---|
| Grip (≡) and Monitors | Drag the header to move the section. Click the title to collapse or expand it. |
| Add Monitor (+) | Opens Settings → Monitors, with the Configuration Assistant at Choose Monitor Type. |
| Counts | The number of monitors in each status, with a coloured dot: green for Active, yellow for Warning, red for Error / Unreachable, and grey for Disabled. An eye with a slash counts the monitors that are hidden, for example because they are disabled or can’t be reached. Hover over the counts to see what each one means. |
| Split View | Draws download above the middle of each bandwidth graph, and upload below it, each with its own scale. Click it again for the Stacked View. It shows only when you have a bandwidth monitor. |
| Shared Y-Axis Scale | Opens a menu to put monitors of one unit on the same vertical scale. See Shared Y-axis scale. |
| Browse History | Opens a menu of your monitors. Choose one to open its History view. |
Split View and Shared Y-Axis Scale show only while the section is expanded.
Shared Y-axis scale
Section titled “Shared Y-axis scale”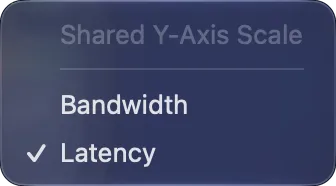
The menu has one item for each unit in the section:
- Bandwidth — puts every bandwidth monitor on one scale, so you can compare throughput directly.
- Latency — puts every latency monitor on one scale.
You can turn on one unit, both, or neither. Each unit has its own scale: a latency graph never shares a scale with a bandwidth graph. The button looks active while a unit shares its scale. Both are off by default.
A Wi-Fi Signal monitor always uses its own two scales.
Scroll back in a graph
Section titled “Scroll back in a graph”Each graph keeps the last minutes of its monitor, up to its Graph Timespan (5 minutes to 1 hour, in the monitor’s settings). To look back:
- swipe sideways on the trackpad over the graph;
- or drag the thin scroll bar at the bottom of the graph. Click the bar beside the knob to move one view.
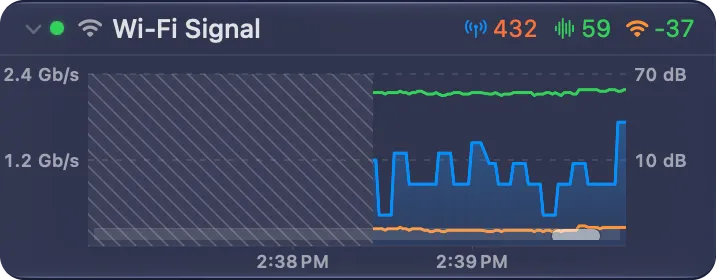
Drag the knob back to the right end to follow the live values again. The scroll bar of a graph is always the thin style. Zoom In and Zoom Out in the graph toolbar show from 30 seconds to 10 minutes.
The order of the monitors
Section titled “The order of the monitors”The monitors show in the order of your monitor list. Drag a monitor in the main window to move it. Monitors of different types can mix, for example a latency monitor between two bandwidth monitors.
To add a monitor, click + in the header. To remove one, right-click it and choose Delete…. See Monitors settings.
Was this page helpful?
Found something wrong, unclear, or out of date? Let us know and we'll fix it.