Dashboard
The Dashboard settings are where you enable and configure the Internet Dashboard — a real-time view of your internet latency, throughput, and connection health.
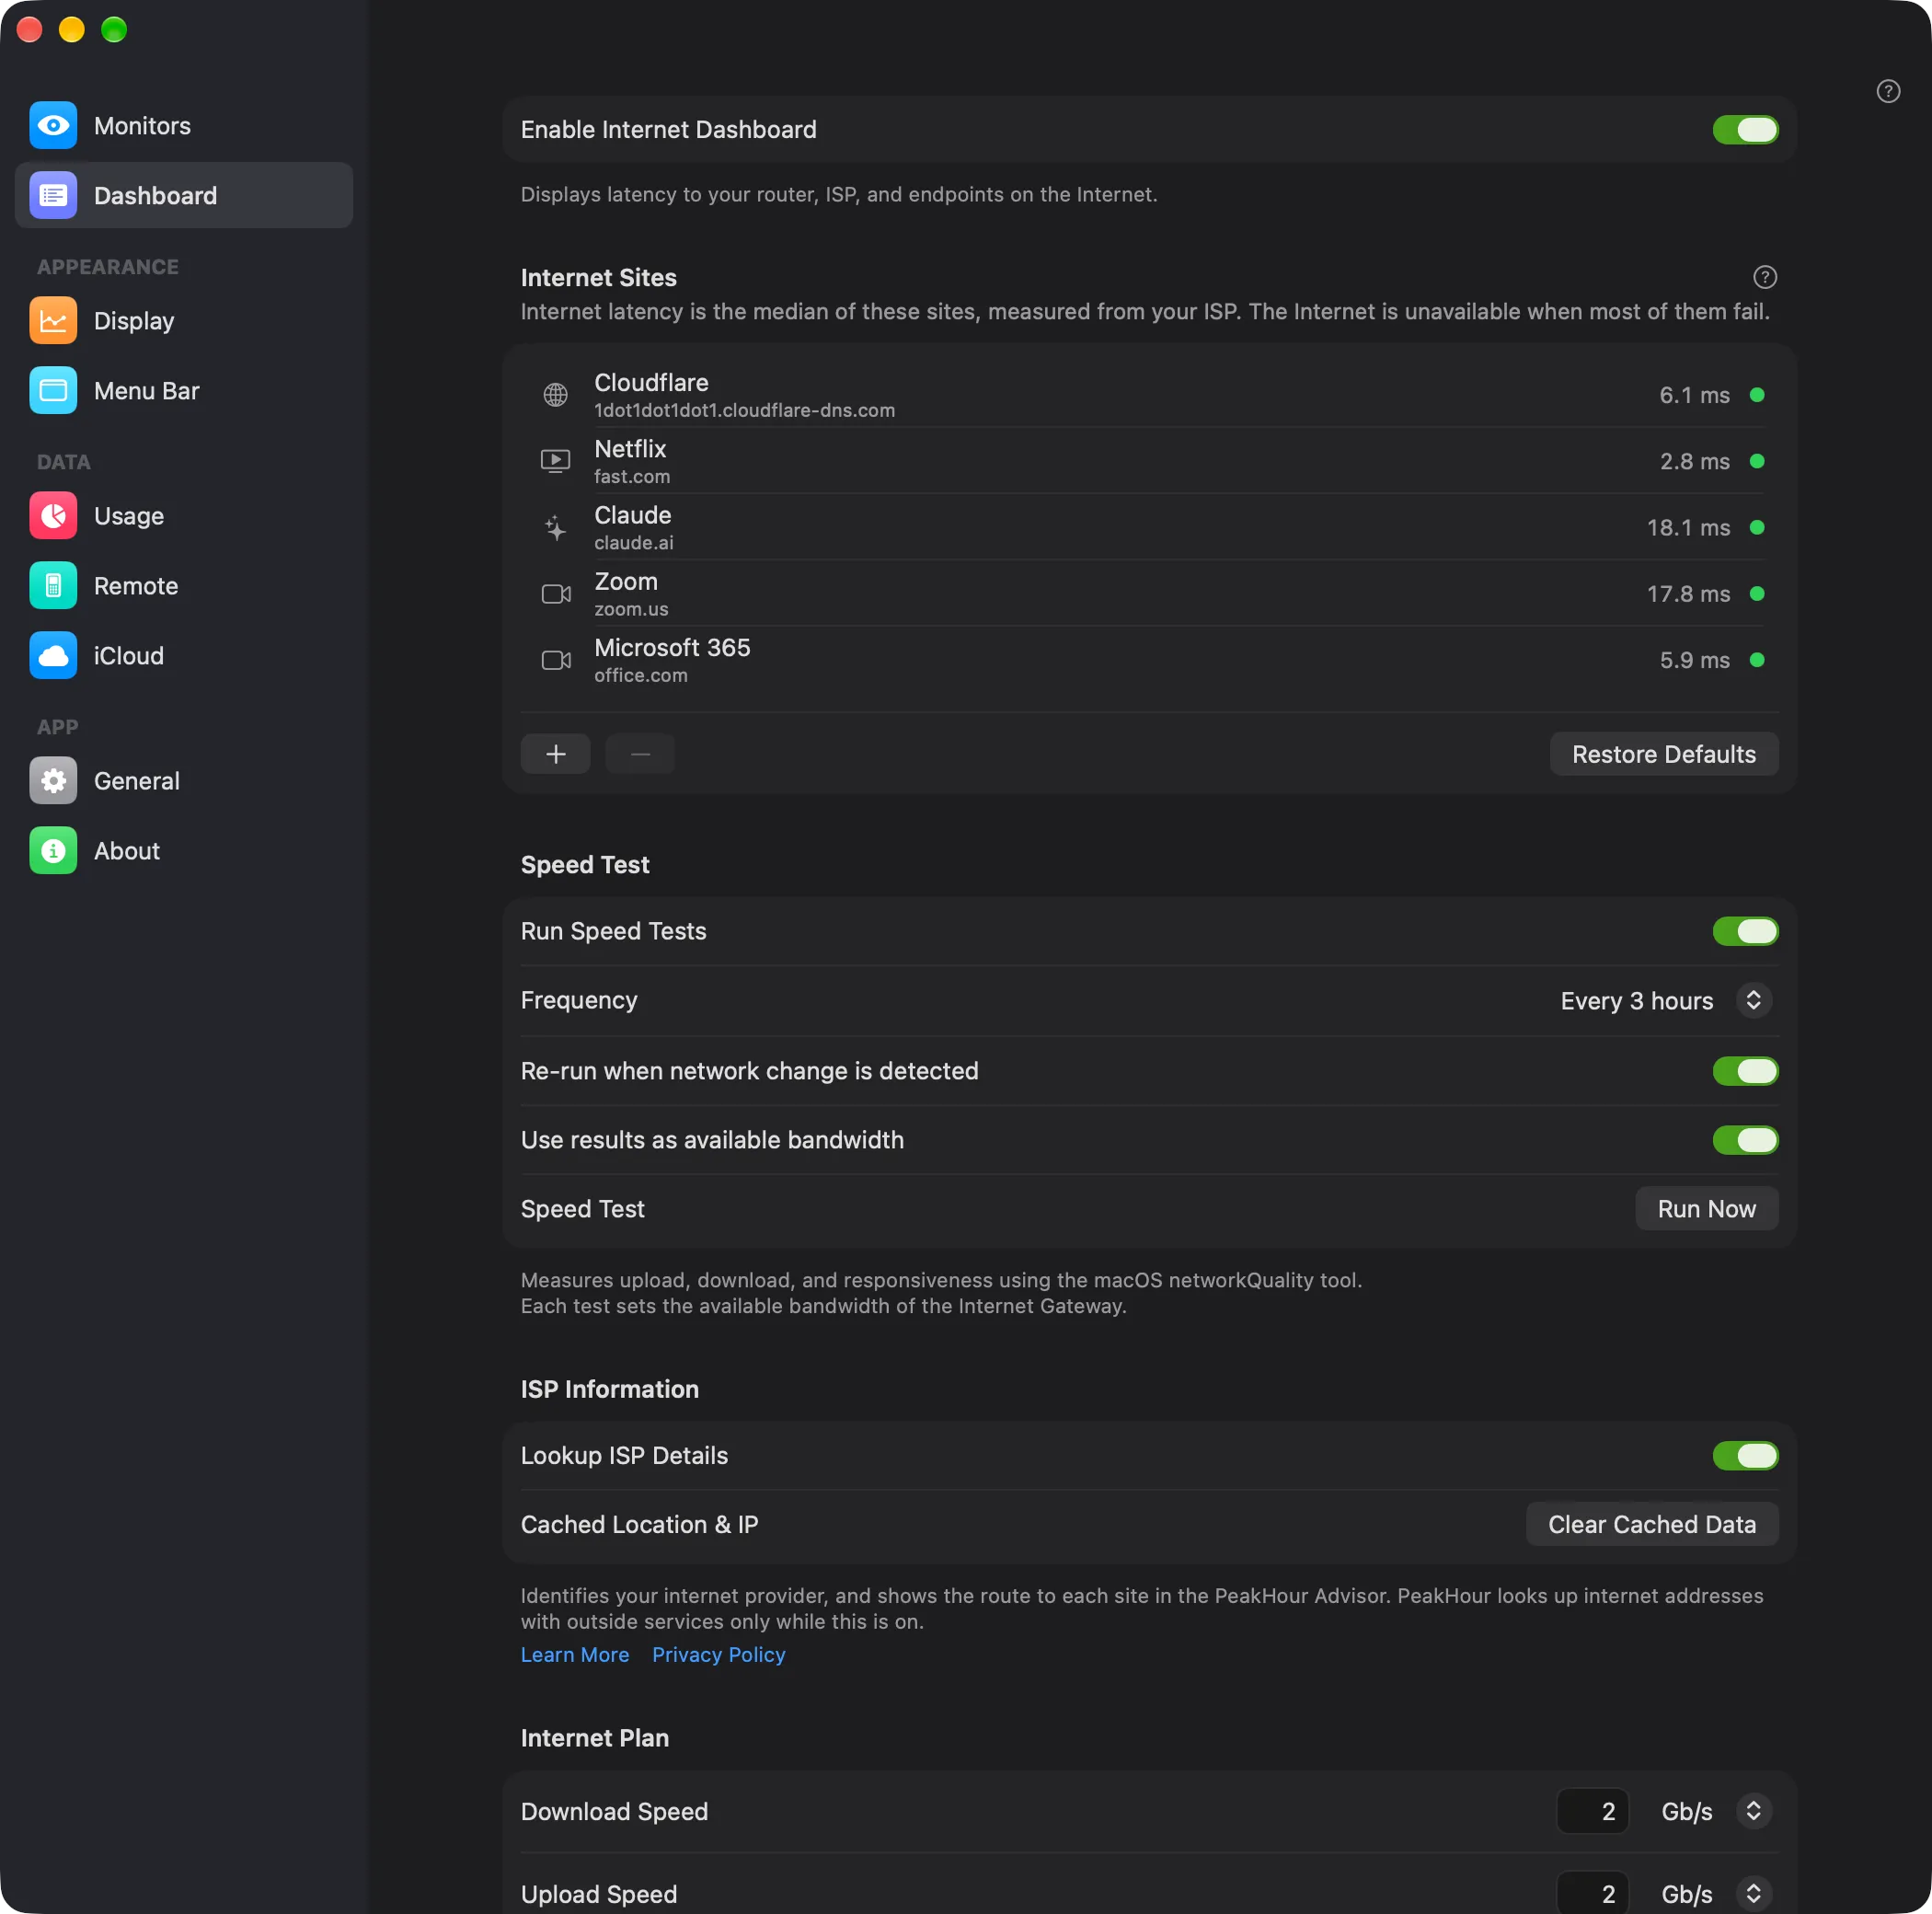
Enable Internet Dashboard — turns the Internet Dashboard on and shows it on the main display, displaying latency to your router, ISP, and endpoints on the internet. For what it shows, see Internet Dashboard. To turn it off, see Turning off the dashboard.
Internet Sites
Section titled “Internet Sites”The Internet Sites list holds the sites that make the Internet status of the dashboard. PeakHour pings each site, and takes the median of their latencies. The Internet is unavailable when more than half of the sites fail. For the full rule, see How the sites make the status.
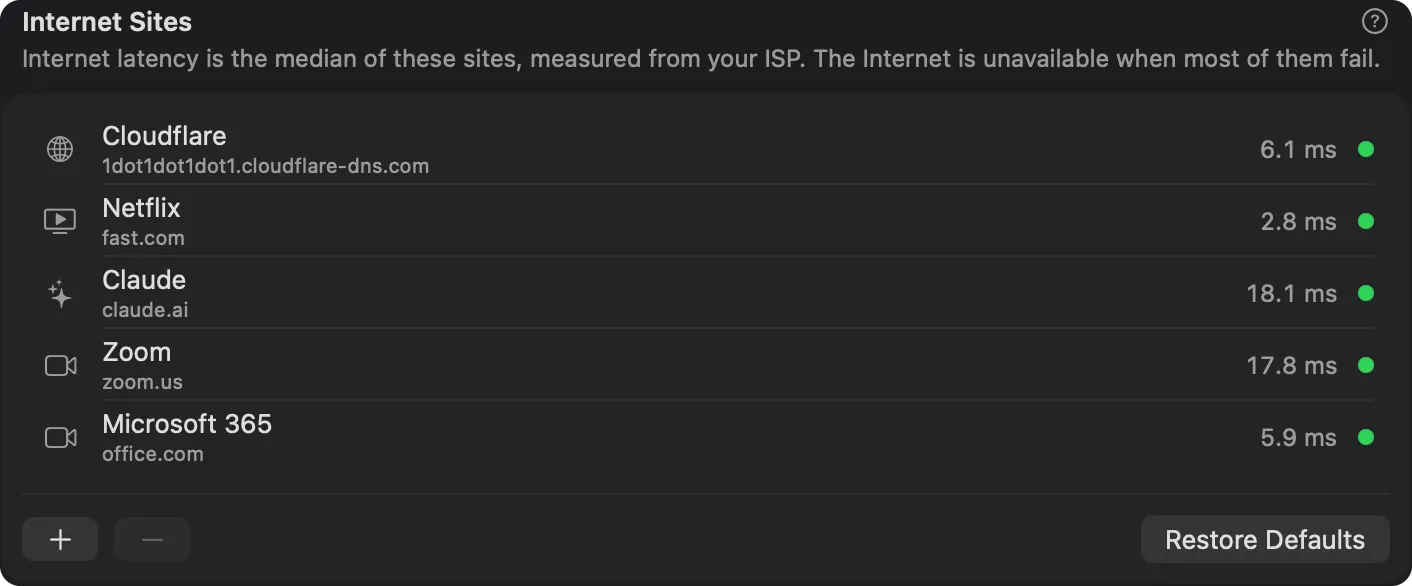
Each row shows the symbol of the site’s group, its name, its host when the host is not the name, and its latency now. A site with no result yet reads Starting…. A site that gives no reply reads Not responding, and a site whose monitor is off reads Disabled. The dot at the end has the colour of the site’s status.
| Control | Description |
|---|---|
| + | Opens Add Internet Sites, to add one or more sites. It is grey when the list has 10 sites. |
| − | Removes the selected site. |
| Restore Defaults… | Asks Restore Default Sites?, then replaces your sites with Google, Cloudflare and Netflix. Removed sites keep their monitors in Monitors. |
Double-click a site to open its monitor in Settings → Monitors. Right-click a site for Show in Monitors and Remove….
The sites appear in the Internet Sites popover of the dashboard, and on The Internet page of the PeakHour Advisor.
Add sites
Section titled “Add sites”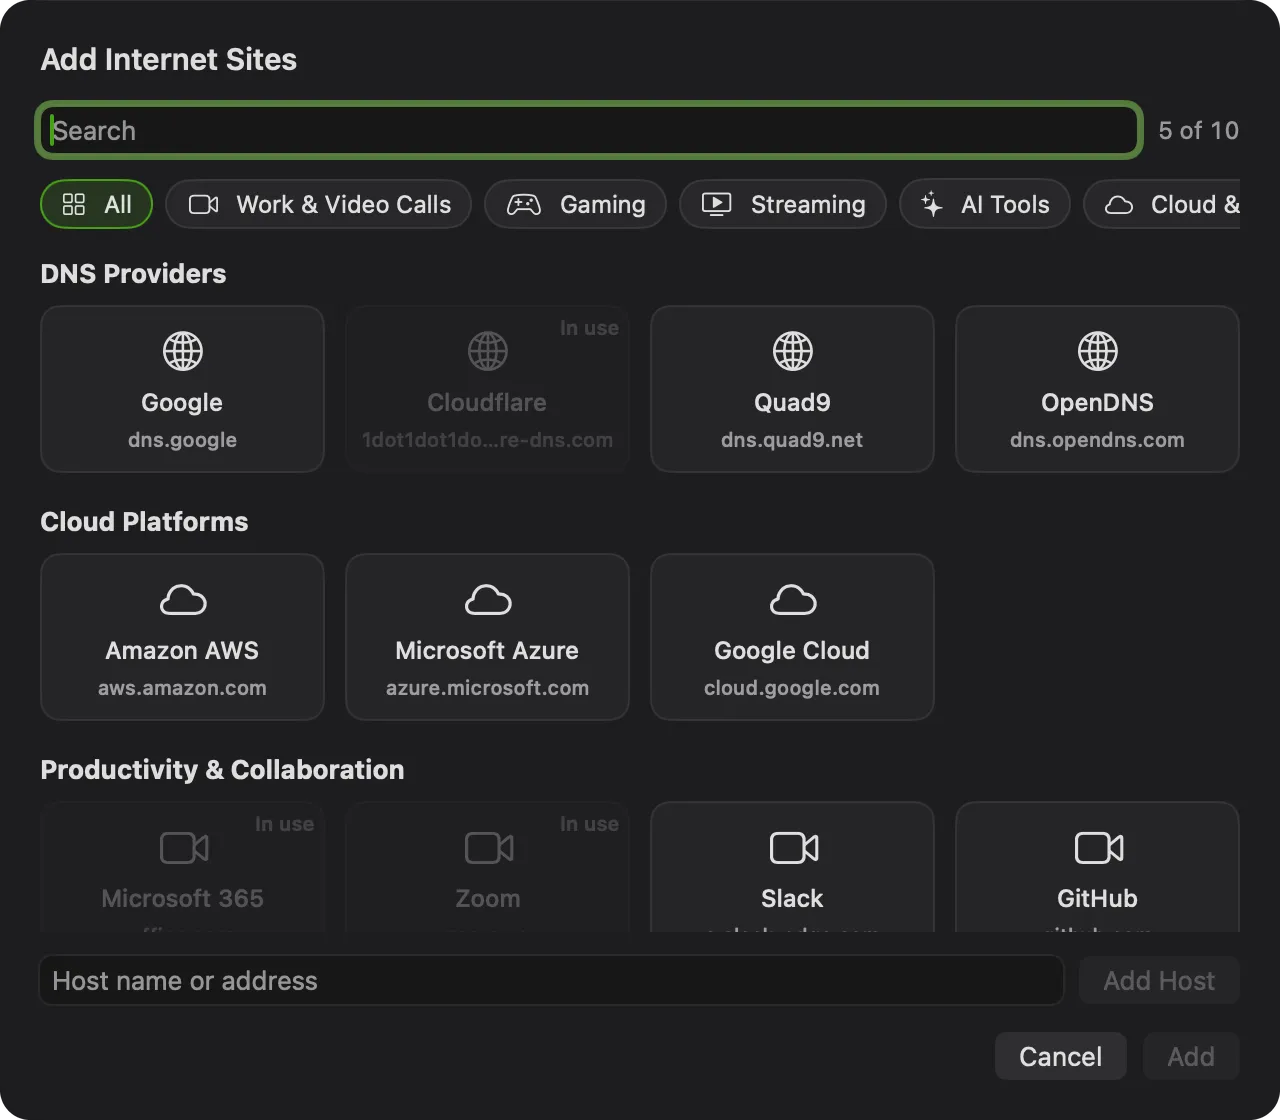
Click + to open Add Internet Sites:
- Click a group at the top, such as Work & Video Calls or Gaming, or type in Search.
- Click each site that you want. The counter beside Search shows how many sites the list will have, for example 5 of 10.
- Click Add.
A site that is already in the list reads In use. For the sites in each group, see The sites to choose from.
To add a site that is not in the picker, type its host name or IP address in Host name or address, and click Add Host. PeakHour checks that the host replies. When it doesn’t, click Add Anyway to add it all the same. See The sites to choose from. When the host is one of the sites in the picker, PeakHour adds that site.
Each new site gets a latency monitor that measures from your ISP to the site, named for example ISP to Zoom.
Remove a site
Section titled “Remove a site”When you remove a site, PeakHour asks what to do with its monitor:
- Keep Monitor — the site leaves the list. Its monitor and its history stay in Monitors.
- Delete Monitor — deletes the monitor and its history too.
- Cancel — keeps the site.
Speed Test
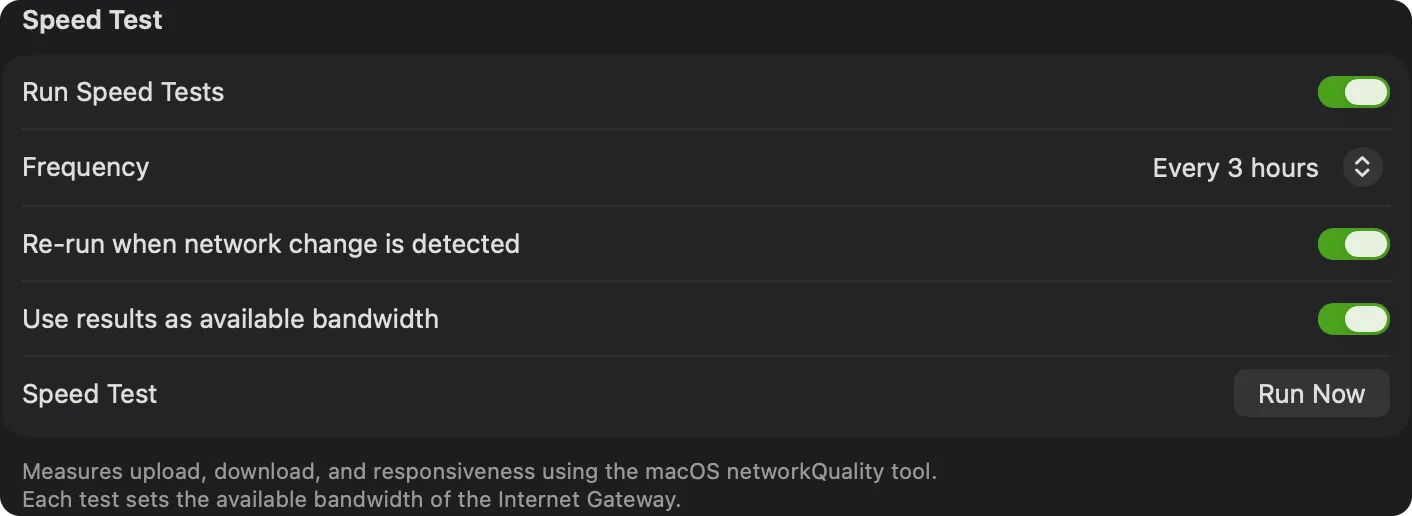
Section titled “Speed Test”PeakHour can run a speed test on a schedule. The test measures your upload speed, your download speed and your responsiveness. It uses the macOS networkQuality tool.
| Setting | Description |
|---|---|
| Run Speed Tests | Runs a speed test on a schedule. The results show under ISP on the dashboard and in its card, on the Advisor’s Speed Test page, and in the Advisor’s speed test history. |
| Frequency | How often the test runs — every hour, 3 hours, 6 hours, 12 hours, day, or week. |
| Re-run when network change is detected | Also runs a test when PeakHour detects a network change, for example a change to another Wi-Fi network. |
| Use results as available bandwidth | Sets the Available Bandwidth of your Internet Gateway from each test. Off by default. See Use results as available bandwidth. |
| Speed Test → Run Now | Runs a test immediately. |
Frequency, Re-run when network change is detected, Use results as available bandwidth and Run Now show only while Run Speed Tests is on. You can also run a test at any time:
- click Run Speed Test or Test Again on the ISP card of the dashboard;
- right-click the Internet Dashboard, then choose Run Speed Test;
- click Run Speed Test on the Advisor’s Speed Test page.
A test needs a working connection. While this Mac is offline, or while the dashboard monitors start, the buttons on the dashboard and in the Advisor are grey. Hover over a grey button to see the reason, for example Offline or Monitors are starting. A scheduled test waits until a test can run.
Use results as available bandwidth
Section titled “Use results as available bandwidth”With this setting on, each new speed test sets the Available Bandwidth of your Internet Gateway to the measured speeds. The footer then reads Each test sets the available bandwidth of the Internet Gateway.
- PeakHour sets Upload and Download to Custom… with the speeds of the test, in the gateway’s Bandwidth settings. The values go up or down with each test, and they replace a value that you typed.
- A result less than half of the median of the last 5 results does not change the values. A test on a busy network does not make the maximum too low.
- A router that PeakHour detected automatically does not change. Adopt it first.
- When you turn the setting off, the values stay Custom…. To go back, choose Automatic in the gateway’s settings.
With the setting off, a speed test can still raise an Automatic maximum, but never lowers it. While you have an Internet plan, the plan sets the maximum of an Automatic direction.
Provider Lookup
Section titled “Provider Lookup”Look Up Provider Details — identifies your internet provider (name, ASN, connection type, and approximate location) from your public IP address, shown in the ISP column of the dashboard and in its card. It also lets the PeakHour Advisor show the route to each site and a map of where each site answers from. The first time setup asks you to choose it on or off.
Clear Cached Data — removes the lookups that PeakHour has cached on this Mac.
For every service that Provider Lookup contacts, what each one receives, and what stays on your Mac, see Provider Lookup.
Internet Plan
Section titled “Internet Plan”Enter the speeds that your internet plan promises, and PeakHour compares your speed tests with them.
| Setting | Description |
|---|---|
| Download Speed | The download speed of your plan. Choose Mb/s or Gb/s from the menu beside it. |
| Upload Speed | The upload speed of your plan, also in Mb/s or Gb/s. |
Leave both fields empty if you don’t want to set a plan. Each change saves at once.
With a plan set, PeakHour:
- shows each measured speed as a share of your plan — for example 82% of plan — on the ISP card and the Advisor’s Speed Test page. The bar is green from 85%, yellow from 70%, and red below that;
- uses the plan as the maximum of the Router readouts on the dashboard, while the router’s maximum is Automatic. An automatically detected router always uses Automatic;
- tells you on the Speed Test page whether your connection delivers your plan, or whether this Mac’s Wi-Fi or cable connection limits the speed;
- records the plan with each speed test in the Advisor’s History;
- gives the plan to Ask, so you can ask whether you get the speed of your plan.
Which network the plan applies to
Section titled “Which network the plan applies to”When Look Up Provider Details is on, PeakHour ties the plan to the ISP you use when you save it. The footer then reads, for example, The plan applies on Comcast (AS7922) only. On another ISP, PeakHour doesn’t use the plan, and the footer adds This Mac uses another ISP now. When Look Up Provider Details is off, the plan applies on every network. For more, see Your Internet plan.
The plan stays on this Mac. PeakHour doesn’t sync it with iCloud, so each Mac keeps its own plan.
AI Advisor
Section titled “AI Advisor”AI Advisor — grades your connection and explains what holds it back, in the PeakHour Advisor window and on the dashboard. It is on by default, and needs macOS 26 or later. With it off, the Advisor window still opens, for your speed tests, your history and the routes to each site. See With the AI Advisor off.
Private Cloud Compute — lets a larger Apple model write the Advisor’s explanations, and lets you ask questions about your connection. The first time setup asks you to choose it on or off. It needs macOS 27 or later with Apple Intelligence. The line under the switch shows whether it is ready, and how much of today’s limit is left. While AI Advisor is off, this switch shows off and is grey. Your choice comes back when you turn the AI Advisor on again.
Notifications
Section titled “Notifications”Send a macOS notification when your connection has a problem. All three switches are off by default.
- Router becomes unreachable — notifies you when your router stops responding, and again when it recovers.
- Internet becomes unreachable — notifies you when more than half of your Internet sites stop responding, and again when they recover. One failing site of three or more never sends it.
- Wi-Fi issues — Weak signal, interference or slow link. Notifies you when your Mac’s Wi-Fi has a problem that lasts 2 minutes.
Wi-Fi issues watches for three problems, while the Wi-Fi carries your Mac’s traffic:
| Notification | When |
|---|---|
| Weak Wi-Fi signal | The signal is below −75 dBm. |
| Wi-Fi interference | The signal-to-noise ratio is under 20 dB. |
| Slow Wi-Fi link | The Tx rate of the Wi-Fi link is under 50 Mb/s. |
PeakHour sends at most one notification in 30 minutes for each problem. Wi-Fi issues works with the AI Advisor off. For steps that help, see Improve a weak Wi-Fi signal.
Visual Effects
Section titled “Visual Effects”Connection particle effects — animated particles flow along the connection lines between hops on the dashboard, visualising live traffic. It is off by default. When it is off, a plain line in the colour of each link’s health joins the hops.
Turning off the dashboard
Section titled “Turning off the dashboard”When you turn off Enable Internet Dashboard, PeakHour asks Delete Dashboard Monitors? and says how many monitors the dashboard uses:
- Delete Monitors — deletes the dashboard’s monitors and their history, and turns the dashboard off.
- Keep Monitors — turns the dashboard off and keeps its monitors in Settings → Monitors.
- Cancel — leaves the dashboard on.
When you turn the dashboard on again, PeakHour creates only the monitors that are missing.
Recreating Internet Dashboard monitors
Section titled “Recreating Internet Dashboard monitors”If you delete one or more of the monitors that power the Internet Dashboard, you can get them back:
- Open Dashboard settings.
- Turn off Enable Internet Dashboard, and choose Keep Monitors.
- Turn on Enable Internet Dashboard again.
PeakHour creates the missing monitors with their default settings. Your other dashboard monitors and their history stay as they are.
Was this page helpful?
Found something wrong, unclear, or out of date? Let us know and we'll fix it.