Display
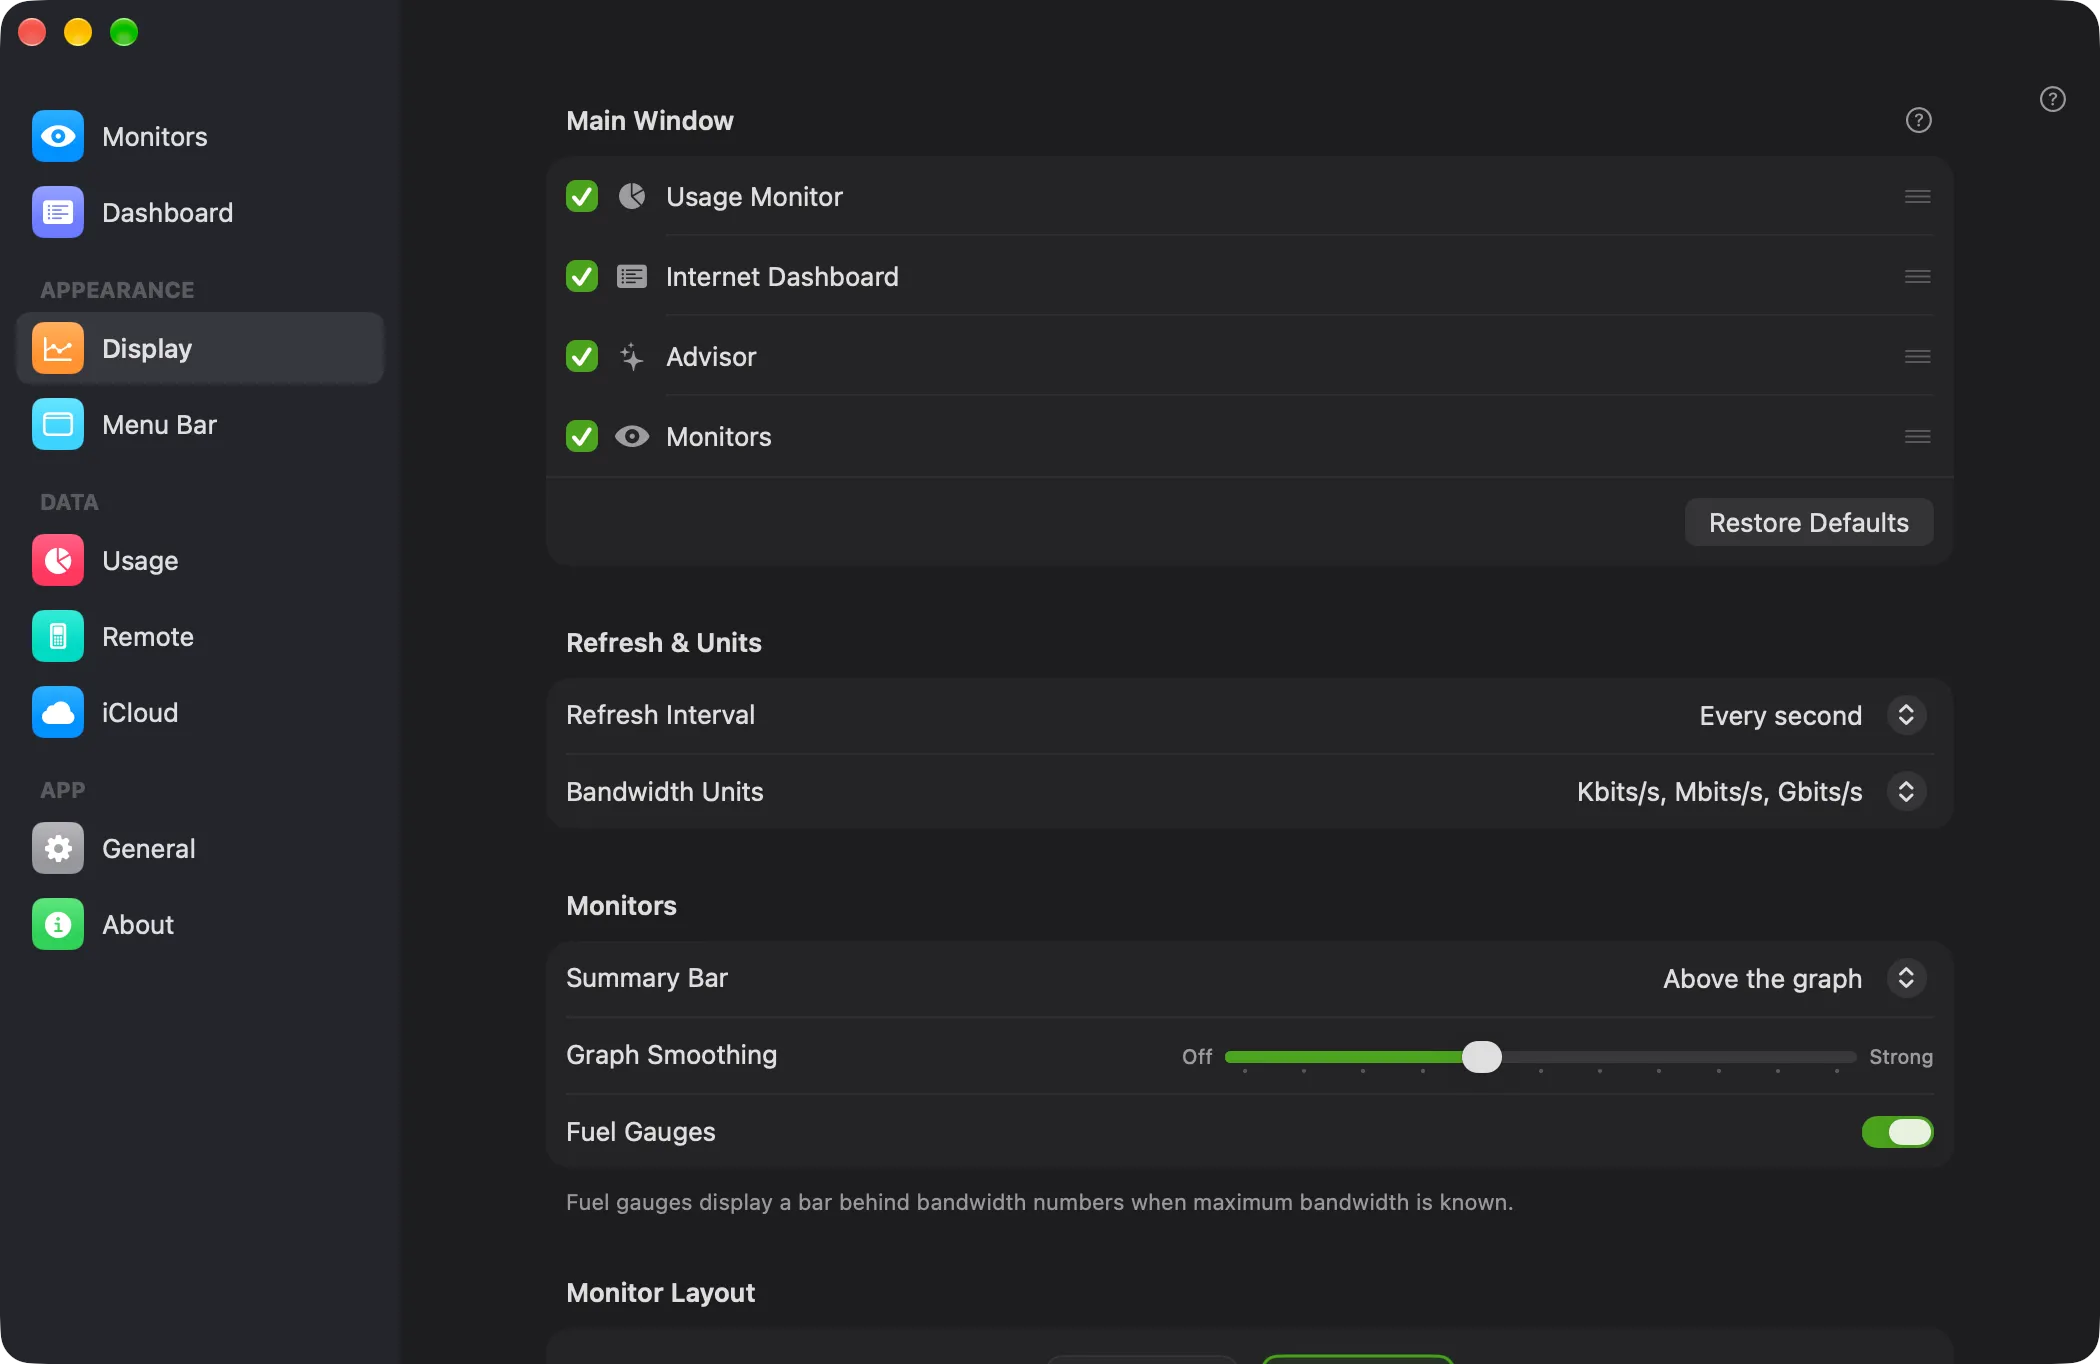
The Display settings control how PeakHour looks and how often it updates.
Main Window
Section titled “Main Window”The Main Window list sets which sections the main window shows, and in which order.
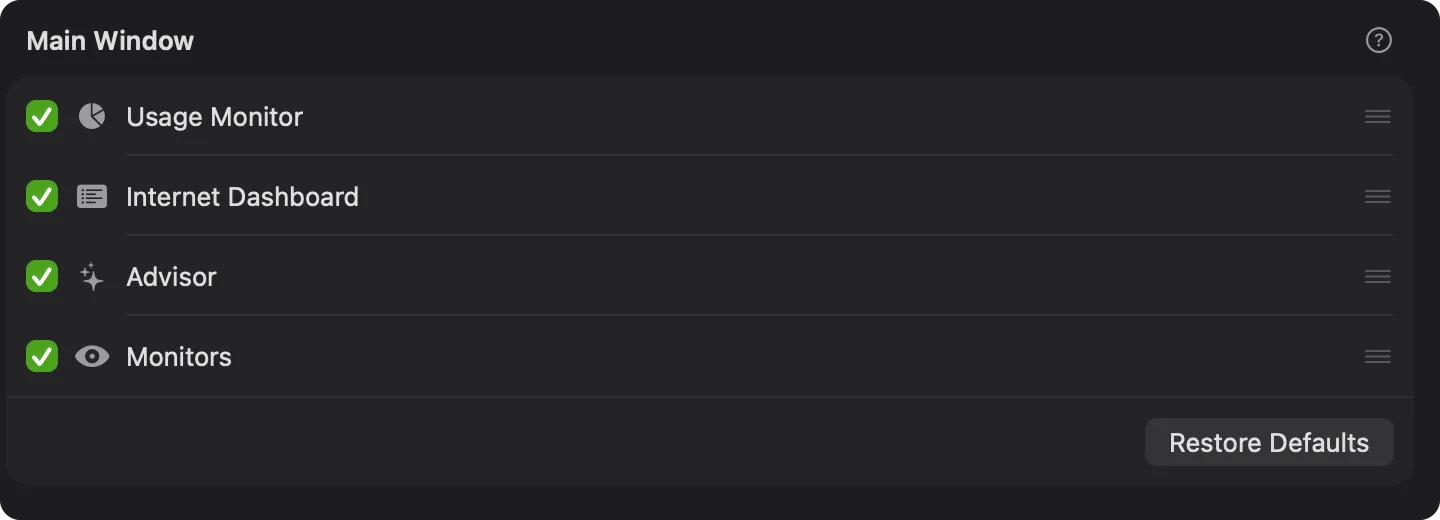
- Select or clear the checkbox of a section to show it or hide it.
- Drag a section by its handle to move it.
- Restore Defaults shows every section again, in the default order: Usage Monitor, Internet Dashboard, Advisor, Monitors.
Each change shows in the main window at once. You can make the same changes from the menu of a section header. See Customize the main window.
A section whose feature is off is dim, with a note such as Usage Monitor is off or Needs the Internet Dashboard. Click the link beside the note to open the settings of that feature. The Advisor row shows only on macOS 26 and later.
Your layout syncs with iCloud.
Refresh & Units
Section titled “Refresh & Units”| Setting | Description |
|---|---|
| Refresh Interval | How often PeakHour polls each monitor for new data. More frequent polling uses more resources on your Mac and on the monitored devices. |
| Bandwidth Units | The units used to display throughput throughout PeakHour — bits per second (Kbit/s, Mbit/s, Gbit/s) or bytes per second (KByte/s, MByte/s, GByte/s). |
Monitors
Section titled “Monitors”| Setting | Description |
|---|---|
| Summary Bar | Whether the summary (current readings) appears above or below the graph. |
| Graph Smoothing | Applies a rolling average to smooth out irregularities. Higher settings make the graph smoother but slower to reflect changes; lower settings make it more responsive but more jagged. |
| Fuel Gauges | Displays a bar behind the bandwidth numbers showing the current speed relative to the device’s maximum bandwidth, when that’s known. |
Monitor Layout
Section titled “Monitor Layout”Choose how monitors are arranged in the main window.
- Single Column — all monitors in one full-width column; the window can be resized to any width.
- Multi Column — monitors laid out in a grid at a fixed width, so you can fit several per row. The window snaps to multiples of that width.
| Setting | Description |
|---|---|
| Column Width (Multi Column) | The fixed width of each monitor card. |
| Graph Height | The height of monitors that show a graph. Summary-only monitors aren’t affected. |
Bandwidth Colors
Section titled “Bandwidth Colors”The colors used for Download and Upload traffic on Bandwidth Monitor graphs. A bandwidth monitor can have its own colors instead: turn on Custom Colors in its settings. See Bandwidth Monitor → Colors.
Latency Colors
Section titled “Latency Colors”The colors used to indicate latency on Latency Monitor graphs, blended as a gradient between them:
| Color | Meaning |
|---|---|
| Normal | Good latency — at or near a monitor’s measured minimum. |
| Slight Congestion | Mild congestion. |
| Heavy Congestion | Significant congestion. |
| Packet Loss | The color of the packet-loss line in the History view, which shows the percentage of packets lost in each period. It isn’t shown on the live monitor graph. |
Click Reset Colors… to restore the defaults.
Congestion Thresholds
Section titled “Congestion Thresholds”How much latency above a monitor’s measured minimum counts as congestion:
| Setting | Description |
|---|---|
| Slight Congestion | Additional latency above the minimum before the connection is considered slightly congested (default 75 ms). |
| Heavy Congestion | Additional latency above the Slight Congestion level before it’s considered heavily congested (default 125 ms, so 200 ms above the minimum). |
Click Reset Thresholds… to restore the defaults. Each monitor’s minimum-latency baseline is set on its own Latency Monitor settings. Each Internet site uses these thresholds against its own minimum.
Interface
Section titled “Interface”| Setting | Description |
|---|---|
| Appearance | System follows the macOS appearance (System Settings → Appearance), or force Light or Dark. |
| Smooth Scrolling | Slides the graph sideways smoothly using Core Animation. Uses more of your Mac’s resources. |
| Enable Vibrancy | The ‘frosted glass’ effect that lets colors behind the window bleed through — affects monitors and History windows. |
Was this page helpful?
Found something wrong, unclear, or out of date? Let us know and we'll fix it.